Industry
Unified Cloud Communications
2023
Lead UX designer
Stack
Figma, Jira, Microstrategy
Discussions with partners highlighted their need for a dashboard to track whether users used their provided Services (Voice, Chat, Meeting). There was a need to provide proof and better understand whether their customers were engaging with these services.
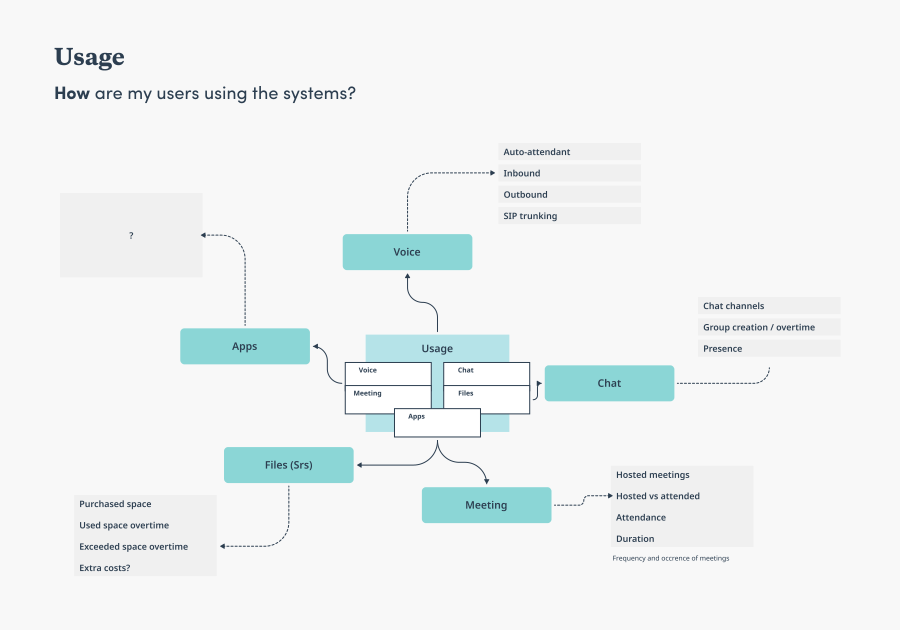
The Service Adoption dashboard monitors on a very high level, how many users have tried the services of the Unite application (Voice, Chat, Meeting, and its Apps), and how many regularly engage with these services over time.
Projects often start without clear direction, as was the case with this dashboard. The Product Owner, being the most knowledgeable, helped us establish weekly meetings to define its purpose, explore visualization options, and align metrics with what Partners already understood.


At first, it wasn’t clear who the audience was, but we assumed roles within Partner Organizations would use it to understand how users engage with the provided Services.
Content Discovery
Initial concept was off the topic but it was required to trigger the conversation.

After I logged in to PowerBi with to see the Internal Analytics I grabbed some metrics and put a draft together to have a visual of what I was trying to measure.
I went back to the Product Owner with questions and I noted what each Metric meant.
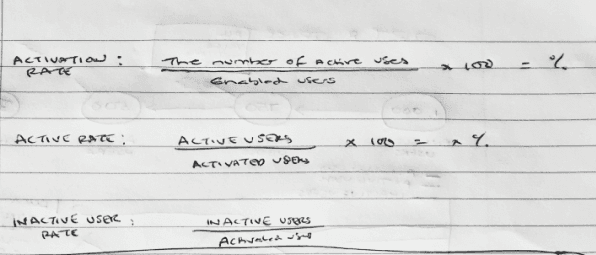

Every week we would meet and explore different angles that would answer specific business questions.
This version shows how many users have attempted to try the services at least once.

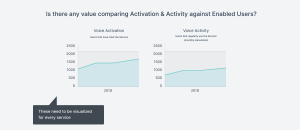
The answer was 'No'. The Enabled users will NOT trend over time. They are enabled in the system once.
Activated users will not trend much but is good to have them plotted over time to know when they happen to activate.
Active users will fluctuate more often therefore we need to have this (although this moves more towards engagement.

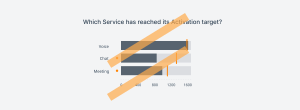
Setting targets would require a tool that would allow each Partner to set different targets.



Recreating the Dashboard in Microstrategy
I had to learn the Microstrategy tool to recreate this dashboard so it could be embedded in our Analytics space.

Understand the Real Needs
When Senior Management requests a project, take the time to thoroughly investigate and validate its value. By speaking directly with Partners, I discovered significant frustration—they had been asking for simpler dashboards that would have provided far more value than the one we delivered.
Ensure Metric Availability
In analytics projects, always confirm that the required metrics are readily available before development begins. In our case, key metrics were missing, leading to months of delays to make them accessible.
While building the dashboard, I reached out to Partners to understand their drill-down needs and future expectations. I mapped their ideas, listing all services and the features they wanted to monitor, split into two key areas: who is using and what they are using, and made plans for future development.