Scaling Intermedia Analytics: A 5-Year Journey

Scaling Intermedia Analytics: A 5-Year Journey

Scaling Intermedia Analytics: A 5-Year Journey

From no analytics tool to a platform used by 60% of 125,000 customers. Five years of building, pivoting, and learning.

From no analytics tool to a platform used by 60% of 125,000 customers. Five years of building, pivoting, and learning.

Industry

Unified Cloud Communications

Timeline

2018 to 2023

Role

Senior UX designer

Stack

Figma, FigJam, Sketch, Miro, Jira

Challenge

Intermedia had no analytics tool. Competitors did. Customers were asking. Everything went through an admin.

Intermedia had no analytics tool. Competitors did. Customers were asking. Everything went through an admin.

My Role

Lead UX designer with full ownership of analytics. I designed every report, every component, and drove the pivot to dashboards.

Lead UX designer with full ownership of analytics. I designed every report, every component, and drove the pivot to dashboards.

2

legacy reports improved

legacy reports improved

legacy reports improved

15

new reports created

new reports created

new reports created

10

dashboards launched

dashboards launched

dashboards launched

60%+

adoption rate

adoption rate

adoption rate

Five years. One platform. Built from scratch.

Five years. One platform. Built from scratch.

Over five years I led the design evolution of Intermedia's analytics platform, beginning with foundational workflows and later pivoting to a dashboard-first strategy.

Over five years I led the design evolution of Intermedia's analytics platform, beginning with foundational workflows and later pivoting to a dashboard-first strategy.

01

2018 — 2019

2018 — 2019

Foundation

Built the platform from scratch. Unified naming system across acquired services. Designed the query layer, dynamic and static filters, chart colour palette, and report templates. Each component tested and built individually.

Naming system

Query builder

Filter system

Chart palette

02

2020 — 2022

2020 — 2022

Expansion

Each new report scoped as its own project on the shared foundation. 15 new reports created, 2 legacy reports rebuilt. As dashboards were being planned, I ran interviews and collected feedback to understand what customers needed from them. That input directly shaped the dashboard scope and priorities.

15 new reports

2 legacy reports rebuilt

Customer interviews

03

2022 — 2023

2022 — 2023

Dashboards

Pushed for interactivity. Took data visualisation courses and proposed moving to dashboards. Intermedia partnered with MicroStrategy. I learned the platform and built 10 interactive dashboards. Adoption reached 60% across 125,000 customers.

MicroStrategy

10 dashboards

60% adoption

Strategy-Driven Content Architecture

Strategy-Driven Content Architecture

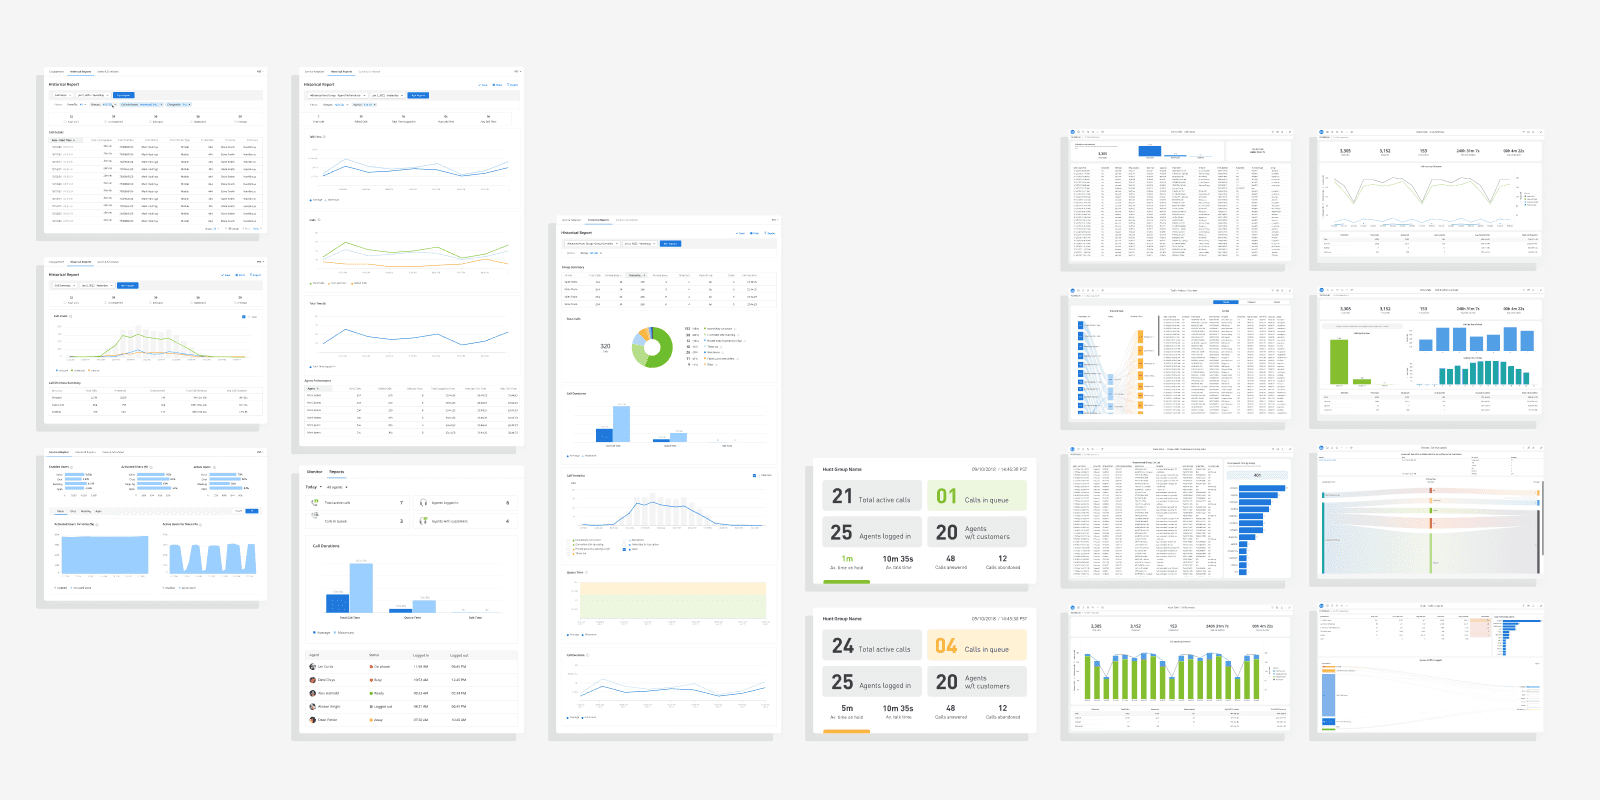
Mapping report coverage across services to support customer needs, uncover metric gaps, and align stakeholders on future opportunities.

Mapping report coverage across services to support customer needs, uncover metric gaps, and align stakeholders on future opportunities.

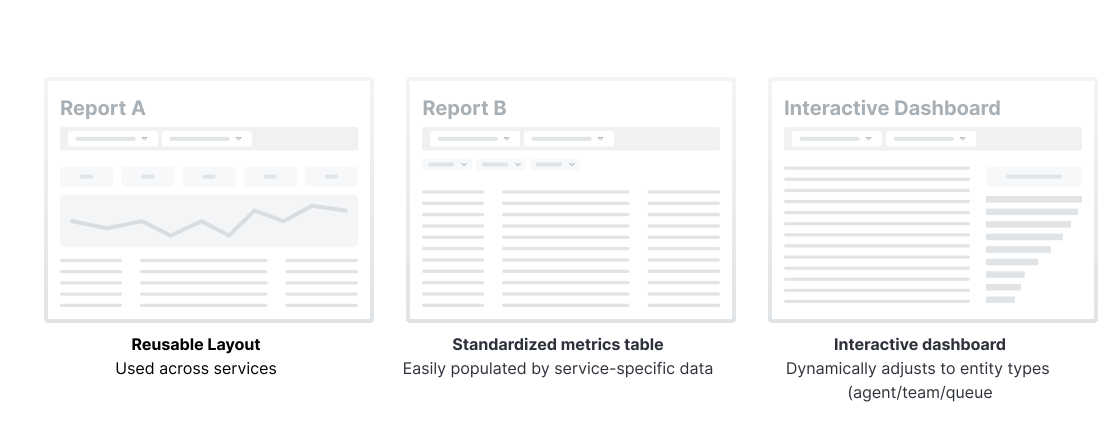
One template. Applied across services.

One template. Applied across services.

From template to shipped product

From template to shipped product

Template A

➝

Final UI

Call Summary

While widely used, this report raised recurring feedback around unclear metric definitions. That input led to backend changes and tighter cross-team alignment, ultimately resulting in the creation of the Unanswered Calls dashboard to provide clearer insights into dropped call volume.

Template B

➝

Final UI

Call Details

A widely-used report designed to surface call volume trends over time. Includes filtering by call type and group, and was used by managers to monitor daily patterns and identify operational bottlenecks.

Scaling Analytics with Interactive Dashboards

Scaling Analytics with Interactive Dashboards

I led the shift to interactive dashboards using MicroStrategy, enabling real-time filtering and targeted views like the Unanswered Calls dashboard.

Call Volume by Direction

Showcased inbound and outbound call volumes at scale. Enabled operations leads to track patterns by region or department and make proactive resourcing decisions.

Showcased inbound and outbound call volumes at scale. Enabled operations leads to track patterns by region or department and make proactive resourcing decisions.

Group Call Traffic

A visual-first dashboard combining volume metrics with Sankey-style flows to reveal call routing paths across groups. Helped managers identify bottlenecks and optimize queue configurations.

A visual-first dashboard combining volume metrics with Sankey-style flows to reveal call routing paths across groups. Helped managers identify bottlenecks and optimize queue configurations.

Abandoned Calls

Provided visibility into high-volume drop-offs across call groups. Helped managers identify service gaps, optimise agent staffing, and reduce customer frustration by tracking abandonment patterns in real time.

Provided visibility into high-volume drop-offs across call groups. Helped managers identify service gaps, optimise agent staffing, and reduce customer frustration by tracking abandonment patterns in real time.

Impact

Impact

What I delivered

Improved 2 legacy reports, created 15 new reports, and launched 10 dashboards, impacting 125,000+ users across the platform.

Improved 2 legacy reports, created 15 new reports, and launched 10 dashboards, impacting 125,000+ users across the platform.

Improved 2 legacy reports, created 15 new reports, and launched 10 dashboards, impacting 125,000+ users across the platform.

Feedback Request Insights

Metrics and attribute configuration were the most requested improvements, based on 4 years of survey and support data.

Metrics and attribute configuration were the most requested improvements, based on 4 years of survey and support data.

Metrics and attribute configuration were the most requested improvements, based on 4 years of survey and support data.

Impact over time

Customer adoption of the analytics platform grew to 60% over five years.

Customer adoption of the analytics platform grew to 60% over five years.

Customer adoption of the analytics platform grew to 60% over five years.

Relfection

Relfection

Five years on one product teaches you things a shorter project never could. I learned that foundations are worth obsessing over — every shortcut in year one became a constraint in year three. I also learned to push for instrumentation early. We tracked adoption through Google Analytics, enough to see the headline number but not enough to understand behaviour. That gap cost us time on every subsequent prioritisation decision.

Five years on one product teaches you things a shorter project never could. I learned that foundations are worth obsessing over — every shortcut in year one became a constraint in year three. I also learned to push for instrumentation early. We tracked adoption through Google Analytics, enough to see the headline number but not enough to understand behaviour. That gap cost us time on every subsequent prioritisation decision.

© Dimitra 2026

© Dimitra 2026

© Dimitra 2026

Create a free website with Framer, the website builder loved by startups, designers and agencies.